Observability Hook Design for Autonomous Agent Failure Diagnosis
Autonomous agents hide failures in decision chains that standard observability tools can't see.
An autonomous agent can fail in a way that produces no red alert, no stack trace, and no error code. An agent that fails does something stranger: it finishes the workflow, hands back an answer that reads fine, and keeps doing this, often dozens of times, with the downstream damage only becoming visible in whatever system the bad output eventually breaks. By then the team is debugging a symptom that showed up three steps and two days after the actual cause.
The tools most teams already own, log dashboards, error-rate monitors, and observability platforms built for single-turn LLM calls, were not built to catch this. Point them at an agent and they'll show you a pile of individual error logs where there's actually one root cause repeating itself, and they'll hand you traces that were never designed to be read across multiple steps. That's a structural mismatch, not a product gap you can close by buying a better dashboard.
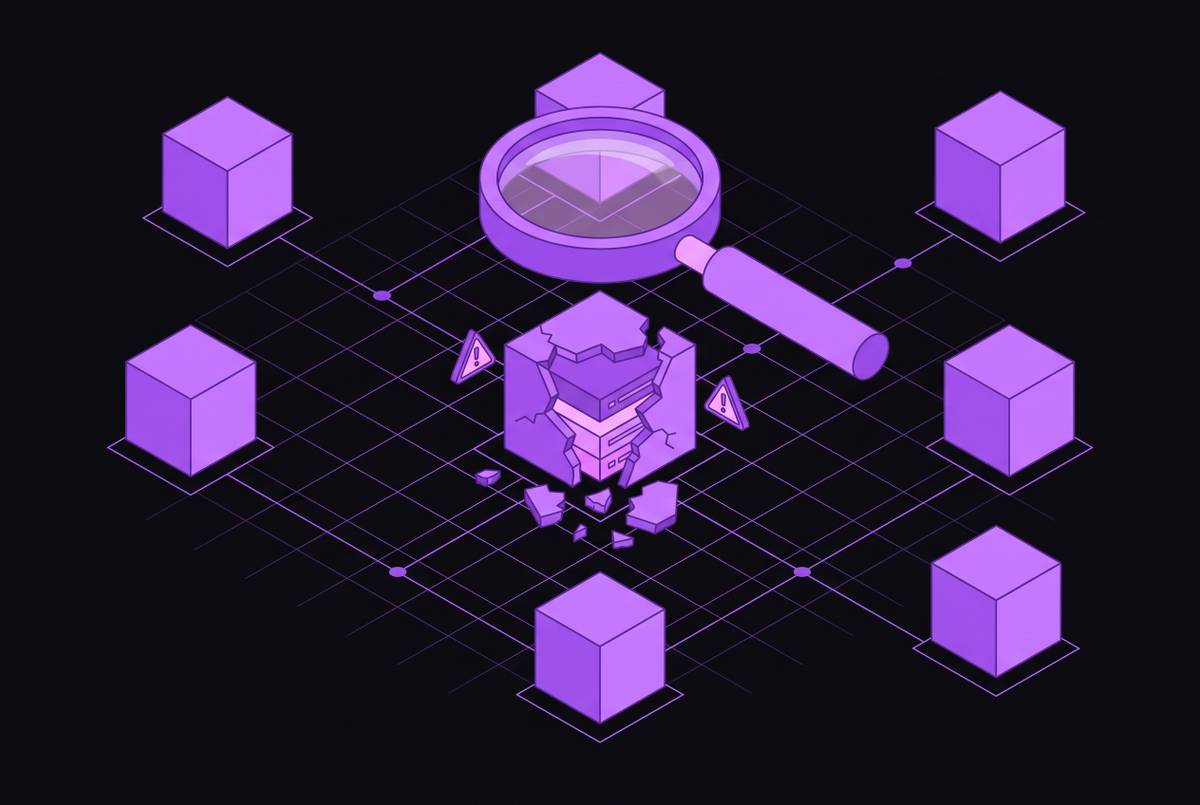
The mismatch matters because agent failures live in the decision chain, not in any single call. A retrieval step pulls the wrong document, and the plan built on top of it goes sideways. A tool call gets a malformed argument, and every step downstream that depends on that argument inherits the corruption. One agent hands a second agent incomplete context, and the second agent produces a confident, wrong answer with nothing in the logs to flag it. None of this is visible to a platform that only looks at the final prompt and the final response. The fix starts with where you put your hooks, not which platform's logo is on the dashboard.
Failure modes hooks must catch
Agent failures split into distinct categories, and each one needs its own observation point. Treating them as one undifferentiated "error rate" keeps most of them from surfacing, because the symptom each one produces looks nothing like the others.
Tool misuse is the most common failure mode in production, and it's also the most insidious, because a single bad call quietly poisons everything that follows. A malformed argument at step 2 doesn't just break step 2. It breaks every step after it that assumed step 2 worked.
Context loss is a separate problem. Each response along the way can look perfectly reasonable on its own. The failure only appears when you line up what the agent was told in turn 2 against what it actually did in turn 8.
Goal drift works the same way but without even a single bad step to point to. No individual action fails. Small reasoning deviations accumulate turn over turn until the final output no longer serves the original goal, and no evaluation of any single span will catch it, because no single span is wrong.
In multi-agent systems, failure propagates. Quality can also degrade gradually with no error code attached at all, invisible to anything that only watches for errors.
The hardest case to catch combines several of these at once: Agent A sends Agent B incomplete or irrelevant context, Agent B produces a confident answer anyway, no exception fires anywhere in the chain, and the dashboard stays green the entire time.
Capturing a diagnostic trace
A trace earns the word "diagnostic" only when it carries enough detail at each step to separate a cause from its effects. Sparse hooks, or hooks placed in the wrong spot, produce a record of what happened and leave a team staring at a timeline when they need an explanation of why.
A working setup needs to cover six kinds of signal. Structural traces come first: every agent run should leave behind a tree of events, including model calls, tool calls, reasoning steps, and errors, in the order they actually happened and with the parent-child relationships between them kept intact. That tree is the ground truth everything else gets checked against. Tool call records come next: which tool got picked, what arguments were sent, what came back, and whether the call actually succeeded, including any error detail. Latency needs to be tracked span by span rather than as one number for the whole run, because breaking total response time down by operation is the only way to tell whether the slow part is the model, the retrieval step, the tool call, or basic I/O. Quality scores, from automated evaluators, LLM-as-judge scoring, and human feedback, check whether the output was correct, since latency numbers and error counts say nothing about whether the answer was right. And user feedback, ratings, corrections, escalations, abandoned sessions, picks up the failures that never throw an error but still leave someone dissatisfied.
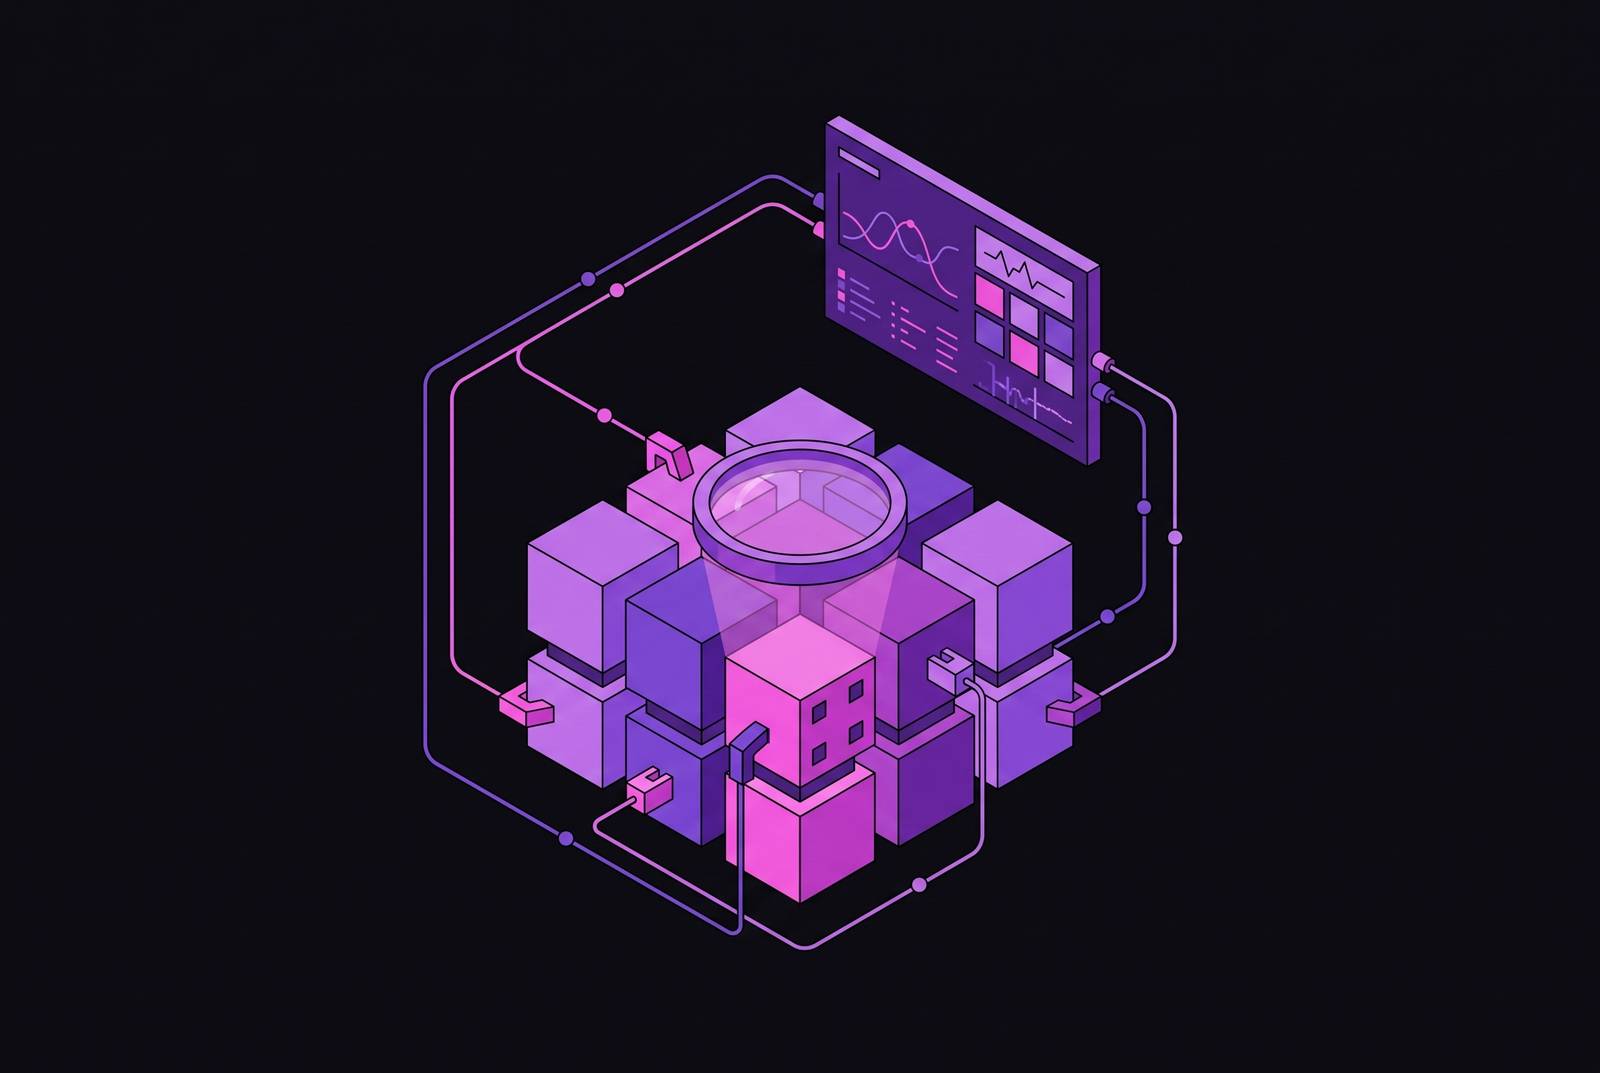
The unit of analysis itself has shifted across all six of these: what you're measuring is the task, not a single model call. The unit of analysis isn't a single model call anymore, it's the task. A hook strategy worth the name needs to show every tool call, every retrieval, every sub-agent handoff, every LLM call, every retry, along with the input, output, latency, cost, and version tied to each one, for the whole run, not just the opening prompt and the closing answer. And traces alone, without scores attached to them, only get a team so far: a platform that shows traces but doesn't score them is a tool for understanding one run after someone already suspects something's wrong. The stronger setup pairs full trace visibility with evaluation scores at the step level and the trace level, so the scoring itself can point at which run deserves a second look.
Placement errors that produce confident-looking but useless data
Most instrumentation problems aren't missing hooks: they're hooks sitting in the wrong place, recording at the wrong level of detail, or recording without the surrounding context that would let anyone connect a symptom back to its cause.
Hooking only at the edges of the workflow, the initial input and the final output, tells you that something broke somewhere, but not where or why. Every failure ends up looking identical: a bad final answer, with the entire decision chain that produced it sitting in the dark.
Hooking tool calls but skipping the arguments and the returned data is a near-universal mistake. It won't show what arguments went in or what came back. It can't tell you whether the call failed because the arguments were malformed or because the tool quietly returned nothing. Those are the two most common tool failures, and this placement error hides both of them behind the same blank trace.
Recording the tool's result but not its execution status is just as costly. A tool that returns HTTP 200 with an empty body looks, to a trace built this way, exactly like a tool that succeeded. The agent moves on, builds the next three steps on top of nothing, and the trace shows a clean run the entire time.
Every one of these mistakes produces the same end state: a dashboard with no red alerts, traces present and accounted for, latency numbers that look normal, and a repeating root cause sitting completely out of view.
A hook placement strategy for multi-step and multi-agent execution
Treat the agent's execution graph, not the overall workflow, as the thing you're instrumenting. That means placing hooks at every node where a decision gets made or context crosses a boundary, not just at the start and end of the run.
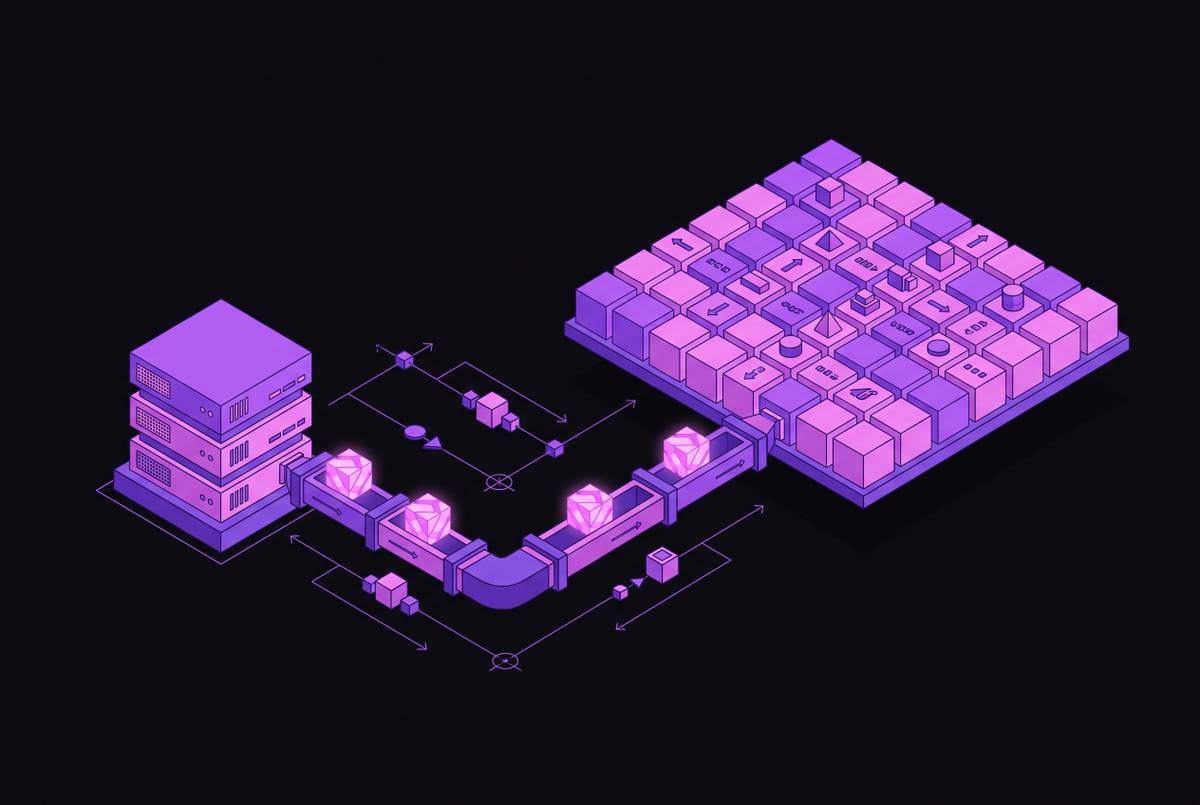
Every tool call boundary needs a hook that captures four fields at minimum: which tool got selected, what arguments were submitted, what result came back, and the execution status including any error detail. Those four fields together are enough to confirm or rule out the single most common failure mode in production.
Every sub-agent handoff needs a hook that captures the actual content passed between agents, not just the fact that a handoff happened. The silent failure where Agent A passes incomplete context to Agent B leaves no other trace, so this is the only place that evidence can live.
Reasoning and planning steps need hooks inside them, not just around them. For an agent that reasons before picking a tool, a span wrapped around that reasoning output is the only way to catch goal drift or a mismatch between what the agent reasoned and what it then did.
Traces need to be grouped into sessions with earlier turns kept retrievable. Diagnosing what went wrong at turn 8 means checking it against what was established at turn 2, and that comparison only works if the session is grouped and the earlier turns are still accessible.
Cost and latency need to be assigned to individual spans, never rolled up to the session level. Span-level attribution is what isolates a runaway loop, a slow retrieval step, or an unexpectedly expensive model call from the rest of an otherwise normal run.
At every multi-agent boundary, instrument both sides: what the sending agent intended to pass, and what the receiving agent actually got. Any gap between those two views is the diagnostic signal for misalignment between agents, visible only when both sides are hooked.
Before touching a prompt, classify the failure. Wrong intent, missing context, retrieval failure, tool error, bad tool arguments, permission denial, a hallucinated completion, a loop or retry explosion, a timeout, a failed human handoff: each of these points to a different fix, and misclassifying one leads to a prompt rewrite that never touches the actual problem.
How observability platforms handle and mishandle hooks
Platform choice isn't the main lever here, but it's not irrelevant either. Diagnostic value depends on whether the platform can actually evaluate what the hooks capture across the full run.
Collecting traces is table stakes at this point; nearly every platform does it. What separates them is whether they can score what's captured at the step level and the trace level, and whether they can surface patterns across production volume instead of leaving a team to click through runs one at a time.
Confident AI builds its product around that idea directly, treating observability as a running quality loop that scores and evaluates traces continuously. It captures full visibility across tool calls, sub-agent handoffs, retrievals, LLM calls, and retries, along with the inputs, outputs, latency, and cost for each. Its agent-step evaluation scores tool selection, tool arguments, planning, retrieval quality, step-level faithfulness, and reasoning coherence. It can point to where in a run things started going wrong.
LangSmith offers native tracing built for teams already working in LangChain and LangGraph. For a team already building on LangChain, that native integration is the clearest advantage.
It groups failures into categories and reports common patterns, suiting it to continuous evaluation running against production volume.
What separates the three isn't whether they collect traces, it's whether they score those traces and cluster the failures found inside them. A platform that only displays traces leaves a team reading logs one run at a time. A platform that scores and clusters turns hundreds of individual error events into a short, prioritized list of actual patterns worth fixing.
The incident response loop that hooks enable
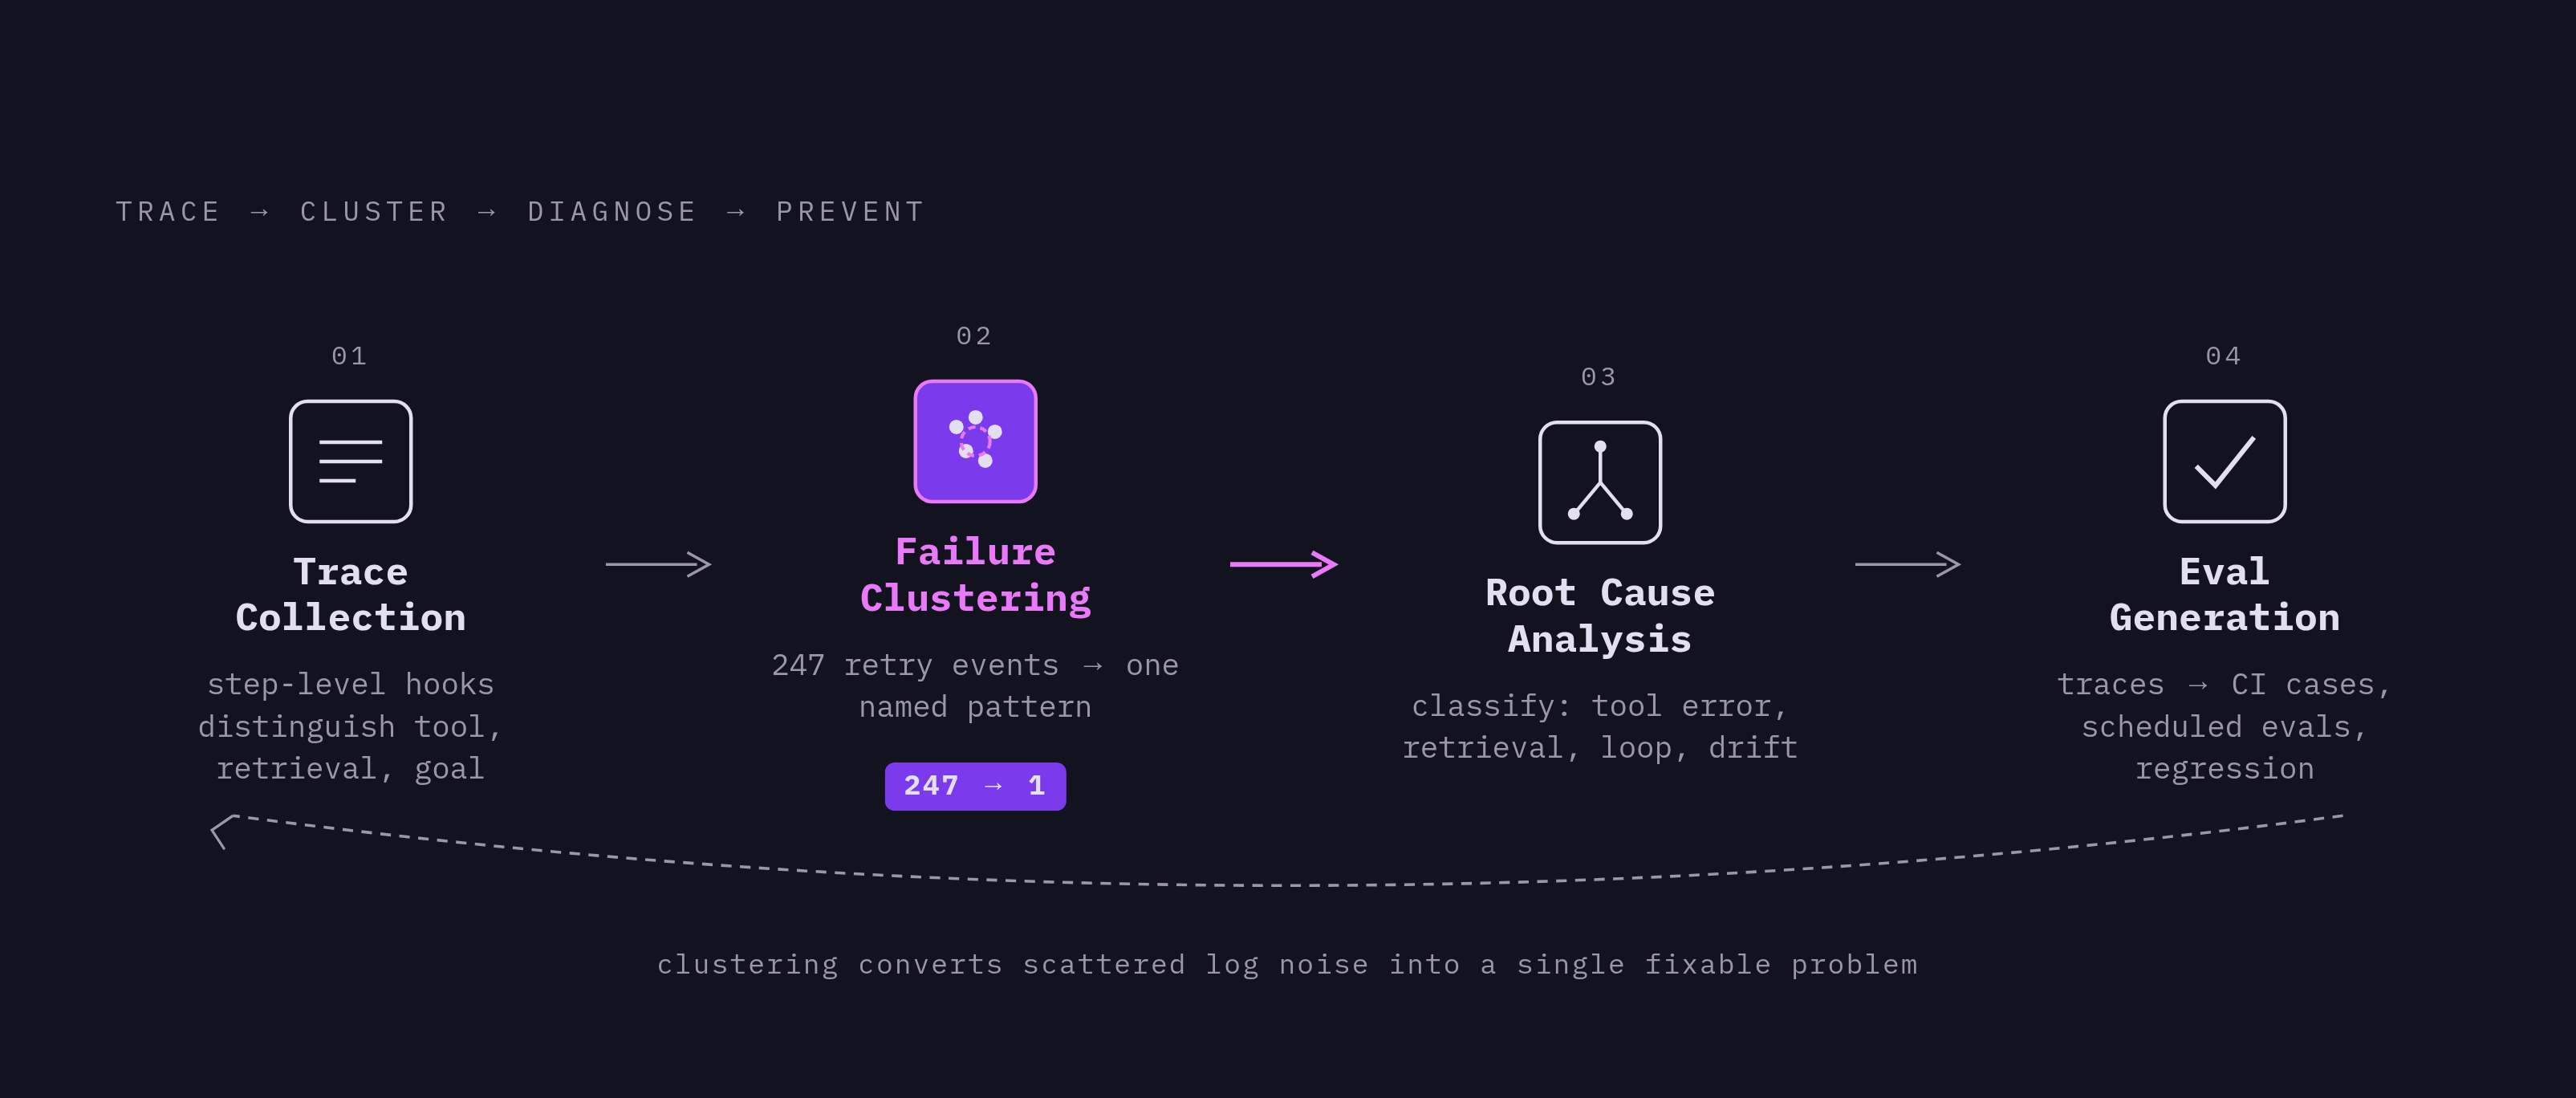
Hooks only pay off once they feed into an actual response process. Without a clear path from alert to root cause to fix, even the best-placed instrumentation just becomes a bigger pile of logs to read after something breaks.
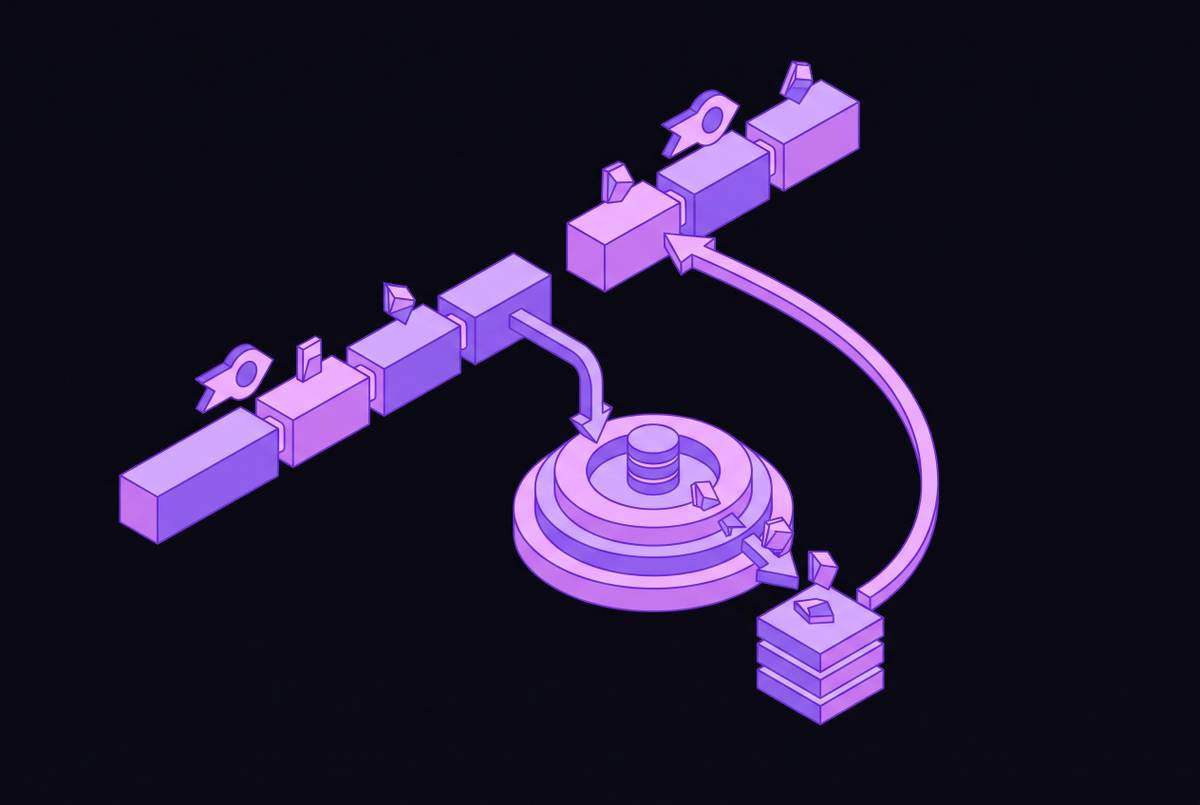
Well-placed hooks support a four-step loop. Trace collection comes first, and structured hooks are what make a trace readable at the step level instead of only the session level: the gap between a trace that says "the agent failed" and one that says "the agent picked the wrong tool at step 3 because the retrieval at step 2 came back empty" is the entire value of this piece. Failure clustering comes next, grouping execution traces by pattern so that hundreds of individual error events collapse into a short, prioritized list. A customer support agent stuck in a retry loop, for instance, surfaced 247 occurrences once those traces were clustered together, turning a scattered pile of logs into one clear problem to fix. Root cause analysis follows, and it starts with classification, not a prompt rewrite: whether the failure was a tool error, a retrieval failure, context loss, goal drift, or a loop explosion determines what actually needs to change, and getting that classification wrong means shipping a fix that doesn't fix anything. Eval generation closes the loop, turning risky production traces into evaluation cases that feed future CI runs, scheduled evals, and regression tests, so the same failure gets caught before it ships again.
Containment needs its own safety valve, separate from root cause work. Production agents should have a feature flag ready that can switch to a fallback, a simpler agent, a hard-coded response, or a handoff to a human, within seconds, without waiting on a full investigation to finish first.
Cost deserves to be treated as its own alert, not an afterthought. A hard spending cap per workflow per day catches a runaway loop before it turns into a real financial problem, and that alert is only useful because span-level cost attribution, built from hooks placed correctly in the first place, tells you exactly which part of the run to look at.
None of this works if the hooks go in after the fact. The diagnostic value of everything described here, the traces, the scores, the clustering, the eval pipeline, depends entirely on placement decisions made before any failure happens. A team that waits for an incident to check its instrumentation will find, in the resulting trace, precisely the blind spot its hooks were built to leave.